
The past two years have seen Japan through an unusually volatile business
cycle. The economy posted an unprecedented steep decline in economic
activity in 2009 of 5.2%, only to come roaring back to life in the first quarter of
2010 with an economic growth rate of 4.2%. The bounce was largely credited
to an increase in external demand as well as positive effects of government
stimulus spending. The Tankan Survey conducted by the Bank of Japan
corresponded with the economic improvement, showing five consecutive
quarterly upticks in its index. But this economic bounce will be followed by a
plateau of milder growth in 2011 due to the expected end of the stimulus
effect. Further uncertainties for the economy include an elevated level of
unemployment as well as the export-related impact of the yen’s appreciation
against major currencies.
This quarterly review of Japan’s property markets begins with the ‘Second
Quarter Market Outlook 2010’. This section explains the latest fundamentals
of each property sector and illustrates trends affecting the finance market,
transaction volumes, cap rates, returns and leasing markets. It also provides
a short-term outlook for each of the major property sectors. Over the past six
months, credit conditions in Japan have gradually improved. Cap rates in
prime locations like the Tokyo CBD have stabilised, if not compressed. More
commercial properties traded in Tokyo in the first quarter of 2010 than any
other city worldwide. Interest in the market, however, has been driven more
by wide yield spreads (among the highest of major global markets) than by
strong property fundamentals. Office leasing remains stagnant and the
vacancy rate continues to rise. Retail indicators appear more hopeful in the
near term, with consumer confidence improving and high street rents
beginning to pick up.
The ‘Research Topic’ section provides each quarter a brief analysis of a topic
that is timely and relevant to Japanese real estate markets. In the previous
edition, we pointed out that based on modern portfolio theory Japanese
pensions in general should increase real estate allocations in their portfolios
in order to maximise their potential across the risk-return spectrum. In this
edition, we add a new component to that discussion. We present an
overview of Japan’s capital market and contrast its structure and key players
with Japan’s global peers. The scale of the country’s capital market is
massive. It ranks second only to the US in overall size, and Japan’s
Government Pension Investment Fund, or GPIF, is the largest of its kind in
the world. As we show in our analysis, Japan’s investors—both households
and institutions—deploy their assets in exceedingly risk-averse ways and this
has historically limited the potential for long-term returns. Compared to
global peers, we find that the long-term returns of Japan’s institutional
investors fall short of their overall potential.

Macro Economy
After posting an unprecedented steep decline in economic activity in 2009
with a contraction of 5.2%, the growth rate in Japan turned positive, rising
4.2% in the first quarter of 2010, thanks to the increase in external demand
and positive effects from the government’s stimulus package. Deutsche Bank
economists expect healthy 3.5% growth in GDP in 2010 to be followed by a
milder plateau of economic growth in 2011, due to the expected end of the
stimulus effect and further uncertainties for the economy given a still high
level of unemployment. The yen’s appreciation against major currencies is
also a big concern for the export-led economy.

The Tankan Survey conducted by the Bank of Japan corresponds with the
current improvement in the economy. The diffusion index (DI) of business
conditions for all industries rose across five consecutive quarters for the
period ending in June 2010. This represents a 9-point gain over the previous
quarter, and a 31-point improvement from the economic trough 15 months
ago. The index for large companies continued to post a robust recovery due
to increases in exports.

Capital Market and Pricing
Previously tight credit conditions are gradually easing. The aggregate amount
of bank borrowings in the real estate industry in Japan was JPY60.4 trillion in
the first quarter of 2010, relatively unchanged from the previous quarter. New
lending for real estate increased 7.6% in the quarter from the same period in
the previous year, and it is the first increase in eight quarters according to the
Bank of Japan. The new finance diffusion index (DI) for J-REITs (red in
Exhibit 4) is still negative in the period, but it has been making continuous
improvement for four quarters running.

The number of real estate transactions started to increase gradually in the
fourth quarter of 2009, fuelled by a series of successful public offerings by JREITs
as they started to acquire real estate assets. The volume of real estate
assets transacted in Japan in 2010 YTD amounted to JPY1.2 trillion by June
2010, compared to JPY 1.7 trillion in FY2009.
fourth quarter of 2009, fuelled by a series of successful public offerings by JREITs
as they started to acquire real estate assets. The volume of real estate
assets transacted in Japan in 2010 YTD amounted to JPY1.2 trillion by June
2010, compared to JPY 1.7 trillion in FY2009.

Below is the list of selected real estate transactions either completed or
announced in the second quarter 2010. J-REITs dominated major
acquisitions in the first quarter but foreign investors and managers (yellow in
Exhibit 8) became more active in the second quarter, especially Asian
investors, although the sizes of some transactions were small. This is
believed to be because asset prices in Hong Kong and other major Asian
countries rose sharply in 2009, and real estate prices in Japan became
relatively cheap (see also Exhibit 5). During the period, the US-based
Fortress Investment Group acquired JPY20.5 billion in daVinci Holdings debt
owned by BNP Paribas, as well as the subscription rights to new shares,
leaving Fortress the de facto owner of Japan-based daVinci.

Market Fundamentals: Office
The leasing market tends to lag behind the economic recovery. In fact signs
of recovery for office fundamentals are not evident yet in Japan. The average
office vacancy rate in Central Tokyo3 has been rising for 30 consecutive
months, and it went up to 9.1% in June 2010, breaking all-time worst records
for five consecutive months.
The vacancy rate for newly developed buildings4 in Tokyo (blue in Exhibit 10)
has now jumped to 40%. In the Shinjuku submarket, the vacancy rate for
newly developed buildings skyrocketed to 89% in June 2010. Historically, the
vacancy rate for overall buildings has lagged the vacancy trend for newly
completed buildings. Based on this leading indicator, therefore, the overall
office vacancy in Tokyo is expected to increase a little further, to be followed
by a slow and gradual recovery starting in late 2010.


The vacancy rates in second tier cities have risen above 10%. In June 2010,
the office vacancy rate rose to 15.5% in Fukuoka, 13.4% in Nagoya, 12.1% in
Sapporo and 11.8% in Osaka. Although the increase in vacancy rates in
these regional cities is slowing down, demand is still weak in these markets
and the vacant space is not likely to be absorbed in the near future.
the office vacancy rate rose to 15.5% in Fukuoka, 13.4% in Nagoya, 12.1% in
Sapporo and 11.8% in Osaka. Although the increase in vacancy rates in
these regional cities is slowing down, demand is still weak in these markets
and the vacant space is not likely to be absorbed in the near future.

The recovery of sales at shopping centres and department stores has lagged
high streets. Sales at shopping centres in April and May 2010 (existing store
basis) fell 2.6% from the same period last year, but the speed of deterioration
has been slowing. Sales at department stores declined 2.9% while chain
stores declined 5.1% in the same period.
Nikkei RIM’s consumption forecasting indicator (CFI), a survey that predicts
future consumption trends six months in advance, also indicates recovery of
consumer confidence, recapturing 80 points for the first time since the
Lehman Brothers bankruptcy of 2008. Restrictions on visas for Chinese
tourists to Japan were eased in July 2010, and Japanese high street retailers
expect the number of Mainland Chinese shoppers to increase over the
coming months.

The capital value index of existing condos (i.e., the re-sale price index) hit bottom in August 2009. The price gradually recovered through March 2010,
but has since stabilised.
Residential rents, which have been relatively stable6, started to weaken in
February 2009 and have declined by 5.8% to date. Privately granting new
tenants a free-rent period for a month or two has become a popular incentive,
although it is not reflected in the statistics.
but has since stabilised.
Residential rents, which have been relatively stable6, started to weaken in
February 2009 and have declined by 5.8% to date. Privately granting new
tenants a free-rent period for a month or two has become a popular incentive,
although it is not reflected in the statistics.

Research Topic: Japan’s capital market in a global context
The Japanese capital market is the second largest in the world after the US,
and Japan is also home to the world’s largest pension fund. Yet even in the
global financial market, the scale of Japan’s capital resources frequently
escapes notice. In this analysis, we present an overview of Japan’s capital
market in a relative context. We compare the characteristics of the Japanese
capital market (especially the institutional market) and the funds domiciled in
Japan with global peers.
We begin with a comparison of national household financial assets (shown in
Exhibit 18 on a per capita basis). This exhibit shows how household financial
assets are allocated in selected major countries. Japan’s household financial
assets average US$129,000 on a per capita basis, ranking it second only to
the US as of the first quarter in 2010 (or year-end 2009 for European
countries).
Japan’s households allocate more than half (55%) of their financial assets to
cash and bank deposits (blue in Exhibit 18), reflecting the risk-adverse
character of the average Japanese household7. The Japanese government
has been trying to stimulate equity and mutual fund investment among retail
investors but any significant shift in household investment patterns now
seems to be on hold due to the latest financial crisis.


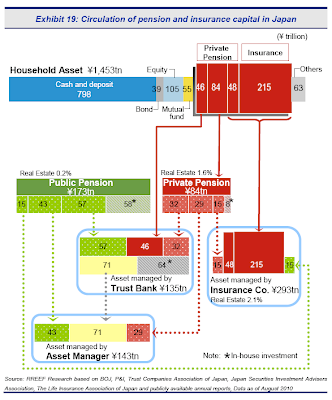
Exhibit 19 illustrates the circulation of pension and insurance capital in Japan
from initial investor all the way through to asset deployment. The chart traces
the scale of capital entering the market from original sources (i.e.,
households and public pensions), then follows this capital through a complex
path of pass-throughs and investment relationships to show which
institutional players ultimately deploy these assets. The aggregate asset size
held by households in Japan was JPY1,453 trillion (tn) as of the end of the
first quarter 2010, with 27% of that total held as life insurance or in private
pensions (red in Exhibit 19). This proportion (27%) is exactly the same as the
one shown in Exhibit 18 above.
This private pension money, together with public pension money, is either
7 This huge scale of household bank deposits underlies the current Japanese financial structure
which is characterised by a predominance of indirect financing by commercial banks.managed by trust banks (JPY135tn), by insurance companies (JPY293tn),
and/or by asset managers (JPY143tn) with some portion being managed inhouse
at each pension fund. Allocations to real estate are generally very low
in Japan, about 0.2% at public pensions, 1.6% at private pension funds, and
2.1% at major insurance companies respectively.
Since trust banks manage the largest portion of pension capital directly and
they have the closest relationships with pensions, they are regarded as ‘gate
keepers’ of pension funds in Japan, although more than half of their capital
(JPY 71tn) is being passed on to asset managers indirectly.
 Below is the global ranking of large pension funds and sovereign wealth
funds (SWFs) by asset size. Japan’s Government Pension Investment Fund
(GPIF) is by far the world’s largest fund with an asset size of well over one
trillion dollars, followed next by SWFs of natural resource-producing countries
such as the UAE, Saudi Arabia, and Norway, and then by SWFs of Asian
countries8. Large pensions in Europe, the US, and Asia are ranked as well.
 The following chart shows a comparison of portfolio allocations among major
pensions and sovereign funds, based on publicly available data. Again,
Japanese funds are weighted toward lower risk assets such as government
bonds while the allocations to alternative assets are limited, especially at
GPIF which has no guidelines for allocating to alternative assets. Japanese
private pensions allocate more capital to riskier assets than public funds, but
these private pensions are still relatively more conservative than their global
peers. As a result, returns tend to be low at Japanese funds. Leading global
pensions and sovereign funds have higher allocations to equity and
alternative assets and have generated higher returns than Japanese funds.
 Exhibit 22 shows the largest real estate acquisitions by either pension funds
or sovereign wealth funds since 2009. Some funds which used to have
limited exposure to real estate have become active in the market, purchasing
trophy assets across the world. On the other hand, large Japanese pensions
are behind some Asian peers and still keep a low profile in the real estate
world.
 Based on our analysis and peer review of national capital markets, we draw
the following conclusions from this edition of ‘Research Topic’ about the key
market players in Japan. First, Japanese households are exceedingly risk
averse and show a strong preference to allocate financial assets to cash
rather than capital market products such as equity or mutual funds. These
preferences may eventually change, but a significant cultural shift is unlikely
to happen soon. While retail investment in the equity and mutual fund
markets still has potential to grow in Japan, the momentum is currently on
hold because of the latest financial crisis.
Second, Japanese institutional investors in general have characteristics
similar to households such as limited exposure to riskier assets. The
Japanese GPIF, for example, has minimal exposure to alternative assets, but
Japanese private pensions allocate more capital to riskier assets.
Nevertheless, Japan’s private pensions still lag their global peers in portfolio
diversification. In fact, Japanese pensions are behind not only western funds,
from initial investor all the way through to asset deployment. The chart traces
the scale of capital entering the market from original sources (i.e.,
households and public pensions), then follows this capital through a complex
path of pass-throughs and investment relationships to show which
institutional players ultimately deploy these assets. The aggregate asset size
held by households in Japan was JPY1,453 trillion (tn) as of the end of the
first quarter 2010, with 27% of that total held as life insurance or in private
pensions (red in Exhibit 19). This proportion (27%) is exactly the same as the
one shown in Exhibit 18 above.
This private pension money, together with public pension money, is either
7 This huge scale of household bank deposits underlies the current Japanese financial structure
which is characterised by a predominance of indirect financing by commercial banks.managed by trust banks (JPY135tn), by insurance companies (JPY293tn),
and/or by asset managers (JPY143tn) with some portion being managed inhouse
at each pension fund. Allocations to real estate are generally very low
in Japan, about 0.2% at public pensions, 1.6% at private pension funds, and
2.1% at major insurance companies respectively.
Since trust banks manage the largest portion of pension capital directly and
they have the closest relationships with pensions, they are regarded as ‘gate
keepers’ of pension funds in Japan, although more than half of their capital
(JPY 71tn) is being passed on to asset managers indirectly.

funds (SWFs) by asset size. Japan’s Government Pension Investment Fund
(GPIF) is by far the world’s largest fund with an asset size of well over one
trillion dollars, followed next by SWFs of natural resource-producing countries
such as the UAE, Saudi Arabia, and Norway, and then by SWFs of Asian
countries8. Large pensions in Europe, the US, and Asia are ranked as well.
pensions and sovereign funds, based on publicly available data. Again,
Japanese funds are weighted toward lower risk assets such as government
bonds while the allocations to alternative assets are limited, especially at
GPIF which has no guidelines for allocating to alternative assets. Japanese
private pensions allocate more capital to riskier assets than public funds, but
these private pensions are still relatively more conservative than their global
peers. As a result, returns tend to be low at Japanese funds. Leading global
pensions and sovereign funds have higher allocations to equity and
alternative assets and have generated higher returns than Japanese funds.

or sovereign wealth funds since 2009. Some funds which used to have
limited exposure to real estate have become active in the market, purchasing
trophy assets across the world. On the other hand, large Japanese pensions
are behind some Asian peers and still keep a low profile in the real estate
world.

the following conclusions from this edition of ‘Research Topic’ about the key
market players in Japan. First, Japanese households are exceedingly risk
averse and show a strong preference to allocate financial assets to cash
rather than capital market products such as equity or mutual funds. These
preferences may eventually change, but a significant cultural shift is unlikely
to happen soon. While retail investment in the equity and mutual fund
markets still has potential to grow in Japan, the momentum is currently on
hold because of the latest financial crisis.
Second, Japanese institutional investors in general have characteristics
similar to households such as limited exposure to riskier assets. The
Japanese GPIF, for example, has minimal exposure to alternative assets, but
Japanese private pensions allocate more capital to riskier assets.
Nevertheless, Japan’s private pensions still lag their global peers in portfolio
diversification. In fact, Japanese pensions are behind not only western funds,
but also some Asian rivals, in diversifying allocations to alternative assets.
Because of their limited exposure to higher risk assets, the long-term return
of Japanese funds tends to be lower than the comparable returns of global
peers.
Finally, we recommend that this quarter’s ‘Research Topic’ be read along
with the previous edition (Japan Real Estate First Quarter 2010) which
focused on portfolio optimisation in April 2010. In the previous edition of
‘Research Topic’ we pointed out that based on modern portfolio theory
Japanese pensions in general should increase real estate allocations in their
portfolios in order to maximise their potential across the risk-return spectrum.By:Koichiro Obu &Orie Endo

No comments:
Post a Comment